

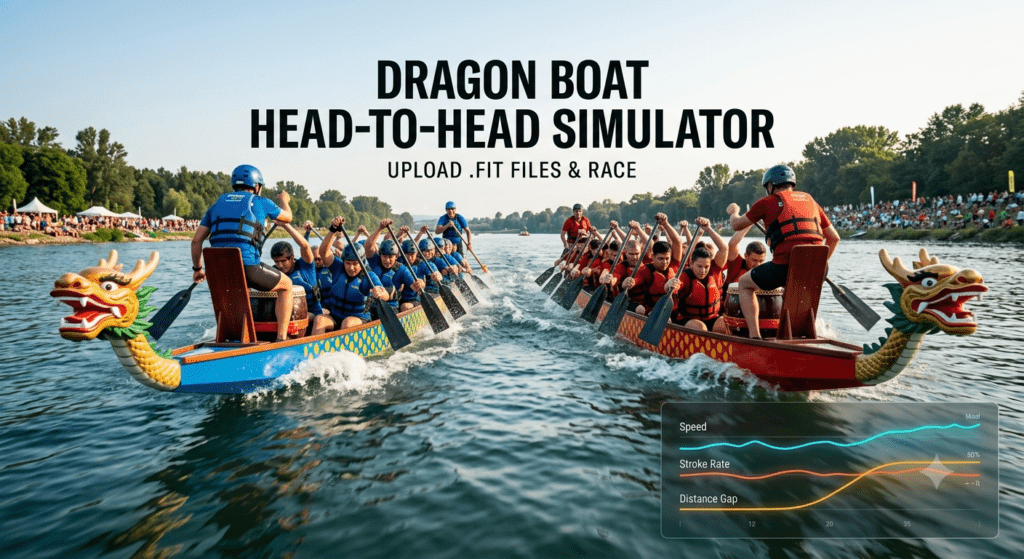
This guide explains how to use the Dragon Boat Head-to-Head Simulator, a specialised analytics tool designed for comparing the performance of two dragon boat crews using their GPS-recorded FIT files.
Purpose of the Application
The Dragon Boat Head-to-Head Simulator is built to provide coaches and paddlers with a data-driven comparison of two racing performances. By analysing telemetry data (GPS, speed, stroke rate, and time), the application allows you to:
- Visualize a side-by-side race: View a virtual simulation of two boats racing over a chosen distance.
- Identify performance gaps: See real-time leader-boards and distance gaps between crews.
- Analyze biomechanics: Review detailed charts comparing speed, acceleration, stroke rate, stroke length, and power output.
- Evaluate race efficiency: Generate a comparative report that highlights key metrics like total strokes taken and average power output to determine which crew was more efficient.
How to Use the Head-to-Head Simulator
The process is divided into three main stages: Data Input, Segment Selection, and Dashboard Analysis.
1. Upload Your Data
- Locate the FIT files: Ensure you have the
.fitfiles from your GPS devices for both crews (Team A and Team B). - Upload: Click on the “Drop Zone” for each team or click to browse your files.
- Enter Metadata: For accurate power calculations, fill in the crew-specific details:
- Crew Name: A descriptive name for the team.
- Crew Weight: The total weight of the paddlers in kilograms.
- Boat Size: Select between “Standard” (typically 10-seat, 250kg base) or “Small” (typically 5-seat, 80kg base).
- Initialize: Once both files are uploaded and validated, click the “FIND RACE SEGMENTS” button.
2. Configure the Race
The application will automatically parse the files to identify high-speed racing segments within your data.
- Review Detected Distances: The app will show the total race distance detected for each crew.
- Select Comparison Distance: Choose a distance (in meters) that is common to both recordings. You can select from preset distances (e.g., 200m, 500m) or input a custom distance.
- Build the Model: Click “BUILD COMPARISON” to process the data for the selected race length.
3. Analyze the Results
Once the model is built, you will be taken to the dashboard, where you can:
- Run the Simulation: Use the PLAY button to watch a virtual race animation. Use the scrub slider to move forward or backward through the race at specific points.
- Review Performance Charts: Scroll down to inspect the interactive charts comparing:
- Speed & Acceleration: View how quickly each boat accelerated out of the start.
- Stroke Metrics: Compare stroke rate (SPM) and stroke length efficiency.
- Power Output: View the calculated power curve to see which crew maintained better output over the distance.
- Examine the Comparison Table: The final section provides a summary table comparing total time, average speed, power output, and total strokes, clearly identifying the “advantage” for each metric.
Note: To start a completely new comparison, use the “NEW COMPARISON” button located at the bottom-right corner of the page to reset the simulator and clear previously loaded files.