


In this post we will talk about finding the ideal stroke rate for a crew. This ideal stroke rate can also be referred to as the ideal cadence.
In most sports there is a cadence that produces the best performance. Try to run/swim/paddle at a rate too high and you will go slow and lose. A rate too low and you will go slow and lose. We want to match our power output and the cadence (stroke rate) to give the optimal speed.
What is Cadence?
For the purposes of this post we will use the following definition of cadence.
Cadence noun ca·dence | \ ˈkā-dᵊn(t)s \ plural cadences
Definition of cadence
: the beat, time, or measure of rhythmical motion or activity
- the drill sergeant counted cadence.
- the steady cadence of the drums
What is the Sweet Spot?
The “Sweet Spot” that I am referring to is the particular cadence (stroke rate) at which we get maximum speed.
How do we find that magic cadence that maximises our performance?
Our first complication is that this is a team sport. An individual’s cadence sweet spot is more than likely different to another paddler’s sweet spot. What chance do we have of compiling a crew of 20 that all have the same cadence sweet spot? Pretty much ZERO.
So the best we can hope for is to find the crew’s sweet spot – the stroke rate where the crew as a whole performs best. That obviously means there will be paddlers that will be required to paddle outside of their personal sweet spot.
Here is an example:
The graph below is a plot of the power generated by individual paddlers at different stroke rates. (Maybe from an ergo?).
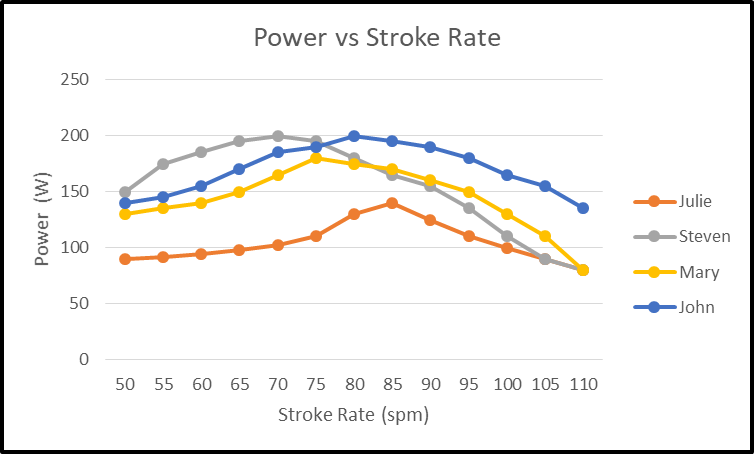
As you can see, different paddlers produce different power at different stroke rates. Steven is an immensely strong paddler but only at low stroke rates. Whereas Julie peaks at 85 strokes per minute. And they are both in the boat along with other paddlers.
At what stroke rate should this crew race?
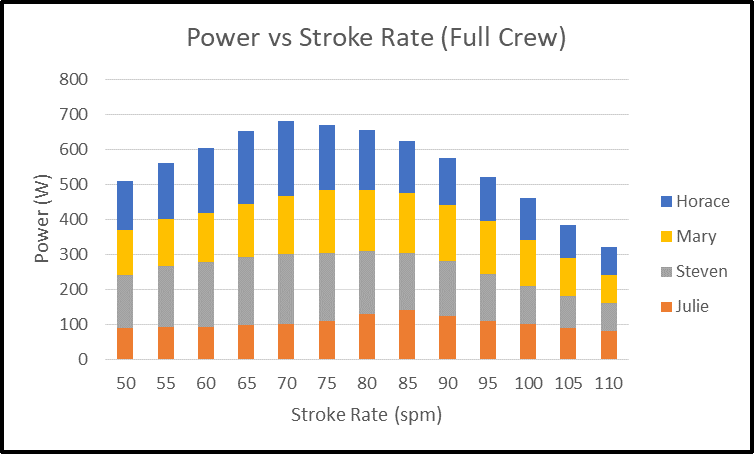
To answer that question, let’s present the data in a different way and stack all the powers and see what happens.

Here you can see the contribution of each paddler to each power bar at each stroke rate. And it is obvious there is peak power at 80 strokes per minute. 80 strokes per minute is the crew’s sweet spot. But also note: only one paddler has that stroke rate as their personal sweet spot – John.
More than likely Steven will say that the rate is too high for him (which is true). Mary and Julie will not be producing their peak power but will at least be close to their personal sweet stroke rates. But as a CREW, they perform best at 80 spm!!
Can This Sweet Spot Change?
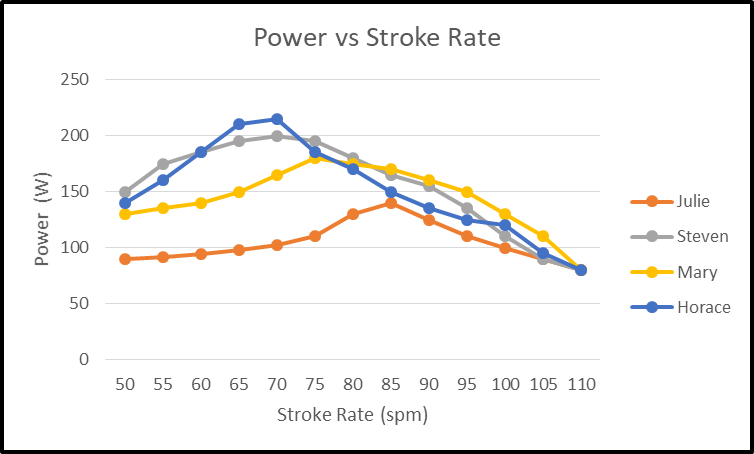
Notice what happens if a paddler is changed out – for example John is out and a new guy, Horace, joins the crew. The crew’s sweet spot changes.
Checking out the graphs below, we can now see that the new sweet spot stroke rate for the crew has dropped to 70 spm.
The analyses above was a very simple overview of the process and why a sweet spot is important.
In reality, the fact that everyone is in a boat together, means that individual power profiles will be influenced by the other paddlers. This will distort the graphs.
The best way to find the sweet spot is to run the crew through different stroke rates and map their speed for each. Only then will you find the real sweet spot for that crew. Which, to be honest, makes sense.
The sweet spot can also change as this crews progresses through the season. As they get fitter, stronger, more efficient and more in tune as a crew, their sweet spot will change.
How to find the Crew’s Sweet Spot
There are a number of ways to find the ideal stroke rate for your crew. I am going to outline the one that I enjoy and that works best with recreational crews.
Method: Rock and Roll and Race
…. The remainder of this content is for members only…
Cover Image supplied by: Dubai Flying Dragons, http://www.dubaiflyingdragons.com/home.html


Great stuff Mark… I have been banging on about cadence and tempo paddling when I was coaching… Music to my ears
Hi Neville,
Great to see your comment. Yes this has been working very well and shown some surprising results. A new post all about these results is on its way.
This analysis is not meaningful without knowing how long each athlete paddled to determine their “ideal” rate. Shorter testing periods will bias the results toward a higher-than-ideal rate.
Hi Tommy
You are correct. The paddling distance should be significant to get meaningful results. As outlined in the article, I usually select “200-250m of straight line water” and get each paddler to paddle at the selected tempo determined by the music. Obviously, if it was over 500m the results would be different but one would expect that.
I hope that clarifies things a bit better. Thanks for your feedback.
Good article ! Just wondering how did you measure the power for each stroke ?
Hi David
Power values at different stroke rates can be measured on an ergo. In this post I just used speculative power curves to show the concept. You do not need to know each individual’s power curve in order to find the sweet spot. Find the stroke rate that gives the fastest boat speed and you have the peak power spot for your crew. In the article Predicting The Performance of Your Crew I explore the use of power factor instead of actual power. That’s why I like algebra because sometimes it allows you to get answers without knowing the values of all the variables in a formula (e.g. power).
Thanks for your question. I hope I have gone some way towards answering your question.
Paddles Up